AGCO Crop Tour Update: 2019 Tillage Trials
The 2019 AGCO Crop Tour is comparing tillage methods for seedbed preparation in terms of plant emergence and growth, spacing, surface residue, root development, soil compaction and yield.
AGCO Crop Tour Update: 2019 Tillage Trials
The 2019 AGCO Crop Tour is comparing tillage methods for seedbed preparation in terms of plant emergence and growth, spacing, surface residue, root development, soil compaction and yield.When it comes to tillage, there are several opinions when it comes to which tool creates the most suitable seedbed right before planting to establish a successful crop. For example, we often hear that a field cultivator produces more compaction than a vertical tillage tool, but then, on the other hand, we often hear the exact opposite! Regardless, we believe it’s important to select the appropriate tillage tool based on data-driven answers from field testing rather than on opinions. That’s why the 2019 AGCO® Crop Tour includes the first year of side-by-side tillage trials to put some of these opinions to the test.
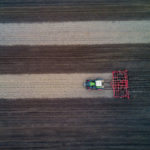
Our tillage plot trials are focused on how secondary tillage passes prior to planting influence seedbed quality, planter performance and yield in both corn and soybeans. Through a collaborative effort with farmers and AGCO dealers, we are comparing different tillage tools across multiple locations that encompass different growing environments and management practices. While the 2019 locations are in Wisconsin and Illinois, our goal over the next few years is to extend our study across several Midwestern regions.
For 2019, individual trials included comparisons between the use of two or three of the following: field cultivator, vertical tillage tool, disc, compact disc, rotary finisher, or even no-till.
Throughout the season, we will be evaluating tillage practices based on differences in:
- plant emergence/growth uniformity
- plant spacing consistency
- surface residue cover
- root development
- compaction
- yield
Using planters equipped with SmartFirmer® seed-firmer sensors and DeltaForce® automated downforce control also will provide additional data to guide our assessments. For example, we’ll measure and map differences across tillage types in terms of the amount of residue in the furrow, furrow moisture, soil temperature, and applied downforce.
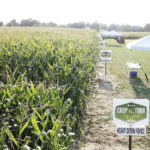
A Challenging Season
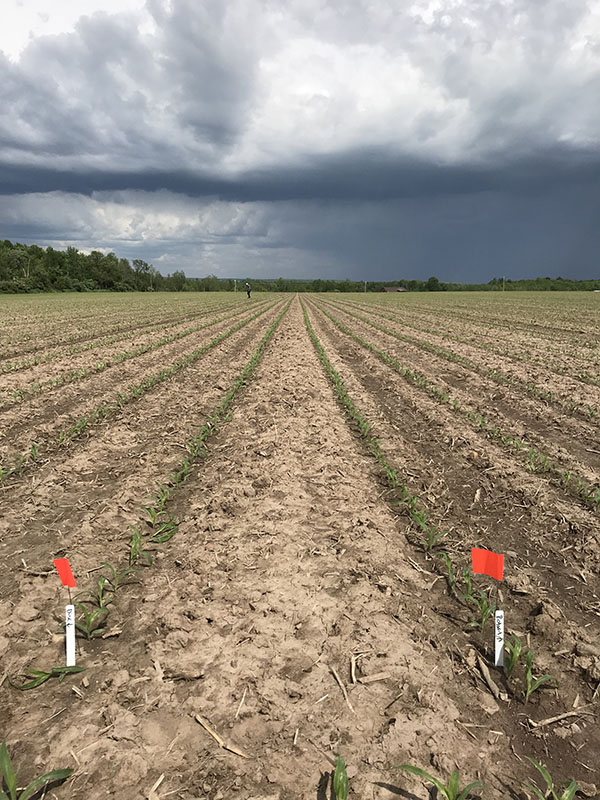
Flags mark comparison rows in 2019 AGCO Crop Tour tillage trial plot.
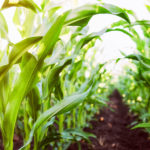
The 2019 growing season so far has presented several challenges, to say the least. Many farmers across the Midwest battled excessive rainfall as they tried to prepare fields and plant crops. Recently, we finally were able to make it around to all of the tillage-trial fields for the first time and begin scouting and collecting data (June 10-14, 2019). Similar to several fields across the Midwest, the crops in our tillage trials were well behind in development compared to “normal” years. Depending on the field, corn plants were anywhere from just emerging to just reaching the second leaf collar stage (V2). The single soybean field contained plants with two (V2) to three (V3) trifoliate leaves.
Overall, crop stage and emergence uniformity was similar between tillage practices across all trials. It’s important to remember that young seedlings rely primarily on stored seed reserves for early growth and development. Therefore, differences in plant response to the various tillage practices may not become noticeable until later in the season. Plant populations in our corn trials, where measured, ranged from 27,000 to 35,000 plants per acre, depending on the field. Plant populations in the soybean trial ranged from 110,000 to 150,000 plants per acre, depending on the area of the field.
In many of the fields, soil conditions were less than optimum. The aftermath of doing tillage in wet conditions was evident, with large, dry soil clods left on the soil surface. However, we did not see a consistent difference in soil conditions specific to one tillage type across multiple trials. In certain fields, however, the amount of surface residue did differ depending on tillage type. For example, use of the Sunflower™ 6830 Rotary Finisher resulted in approximately 7% less residue cover (due to more residue incorporation) than the compact disc in two side-by-side comparisons.
Sensors Can Tell The Story
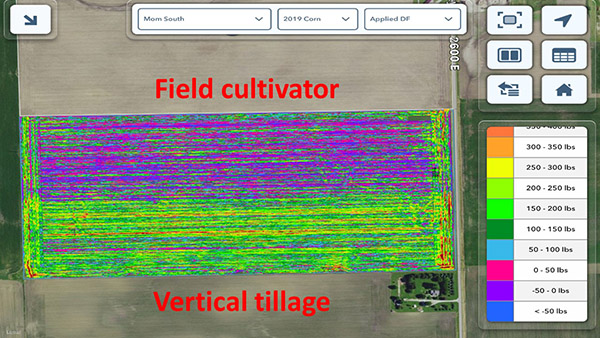
Additional downforce was required to achieve a constant corn-planting depth after vertical tillage (green) vs. use of field cultivator (purple). Data comes from sensors in the DeltaForce downforce control units on each row.
Although differences in plant growth between tillage treatments may not have been visually evident at this stage of the growing season, there were some noteworthy differences measured with DeltaForce and SmartFirmer sensors. For example, according to the as-applied map in one field, additional downforce was required to achieve constant planting depth in areas of the field worked with a vertical tillage tool compared to a field cultivator (see below). The key will be to go back into these areas later in the season to see how the additional downforce impacted plant growth, particularly root development. In the same field, SmartFirmer sensors revealed furrow moisture was generally lower in areas of the field working with a vertical tillage tool compared to a field cultivator (map not shown).
As the growing season progresses and we continue to monitor crop development and collect data at the various tillage sites, we will provide that information here in the Crop Care section of the AGCO blog. Stay-tuned for further research updates!
Author:
Jason Lee
Agronomy and Farm Solutions Specialist, Global Product Management